
1Welcome to REPORTIFUL
REPORTIFUL turns a marketing data export into a branded report your client can act on. This guide shows you how to get there fast, and how to make every report your own.
What REPORTIFUL does
You upload a spreadsheet exported from any marketing tool. REPORTIFUL reads the numbers, works out what changed and why it matters, writes the narrative, and recommends next steps. You download the result as Word, PowerPoint or PDF, branded as your agency.
A report takes 2 to 3 minutes. Large files take up to 6 minutes.
Three things to know first
- Your numbers come from your file. Totals, averages and changes are calculated in code from your data, not estimated. The text around them comes from REPORTIFUL's engine, which combines a marketing knowledge base with AI.
- You stay in control. REPORTIFUL never connects to your ad or analytics accounts. You decide what goes in, and you read the report before it goes out.
- Your brand on the report. Your logo, your colors and your agency name, in Word, PowerPoint and PDF.
Find what you need
| I want to ... | Read |
|---|---|
| Make my first report now | 2 Quick start |
| Get better results from my files | 3 Prepare your data |
| Understand every setting | 4 Settings explained |
| Download, keep and manage reports | 5 Your finished report |
| Make each report my own before I send it | 6 Before you send |
| Build a monthly routine that takes minutes | 7 The reporting workflow |
| Get more out of every report | 8 Tips for better reports |
| Fix a problem | 9 Troubleshooting |
| Set up exports in GA4, Google Ads, Meta and others | Appendix A Export recipes |
| Use a standard file layout and checklists | Appendix B Layout and checklists |
2Quick start: your first report in 5 minutes
You need an account, one data export and about 5 minutes. Your first 3 reports are free.
Before you start
- An account. Sign up at reportiful.com with your work email, then click the confirmation link we send you. If it does not arrive, check your spam folder. REPORTIFUL is for business use only.
- A free email address? If you sign up with Gmail, Outlook or similar, you confirm your company website once to unlock the 3 free credits.
- One data export from any marketing tool, saved as .xlsx, .xls, .csv or .tsv. A recent month from Google Ads, Meta Ads or GA4 is a good first test.
Step by step
In a hurry? Most settings are pre-selected, and changing them is optional. For a really quick first report, just do steps 1, 2, 3, 4 and 7.
- Sign in. Click Sign In at reportiful.com.
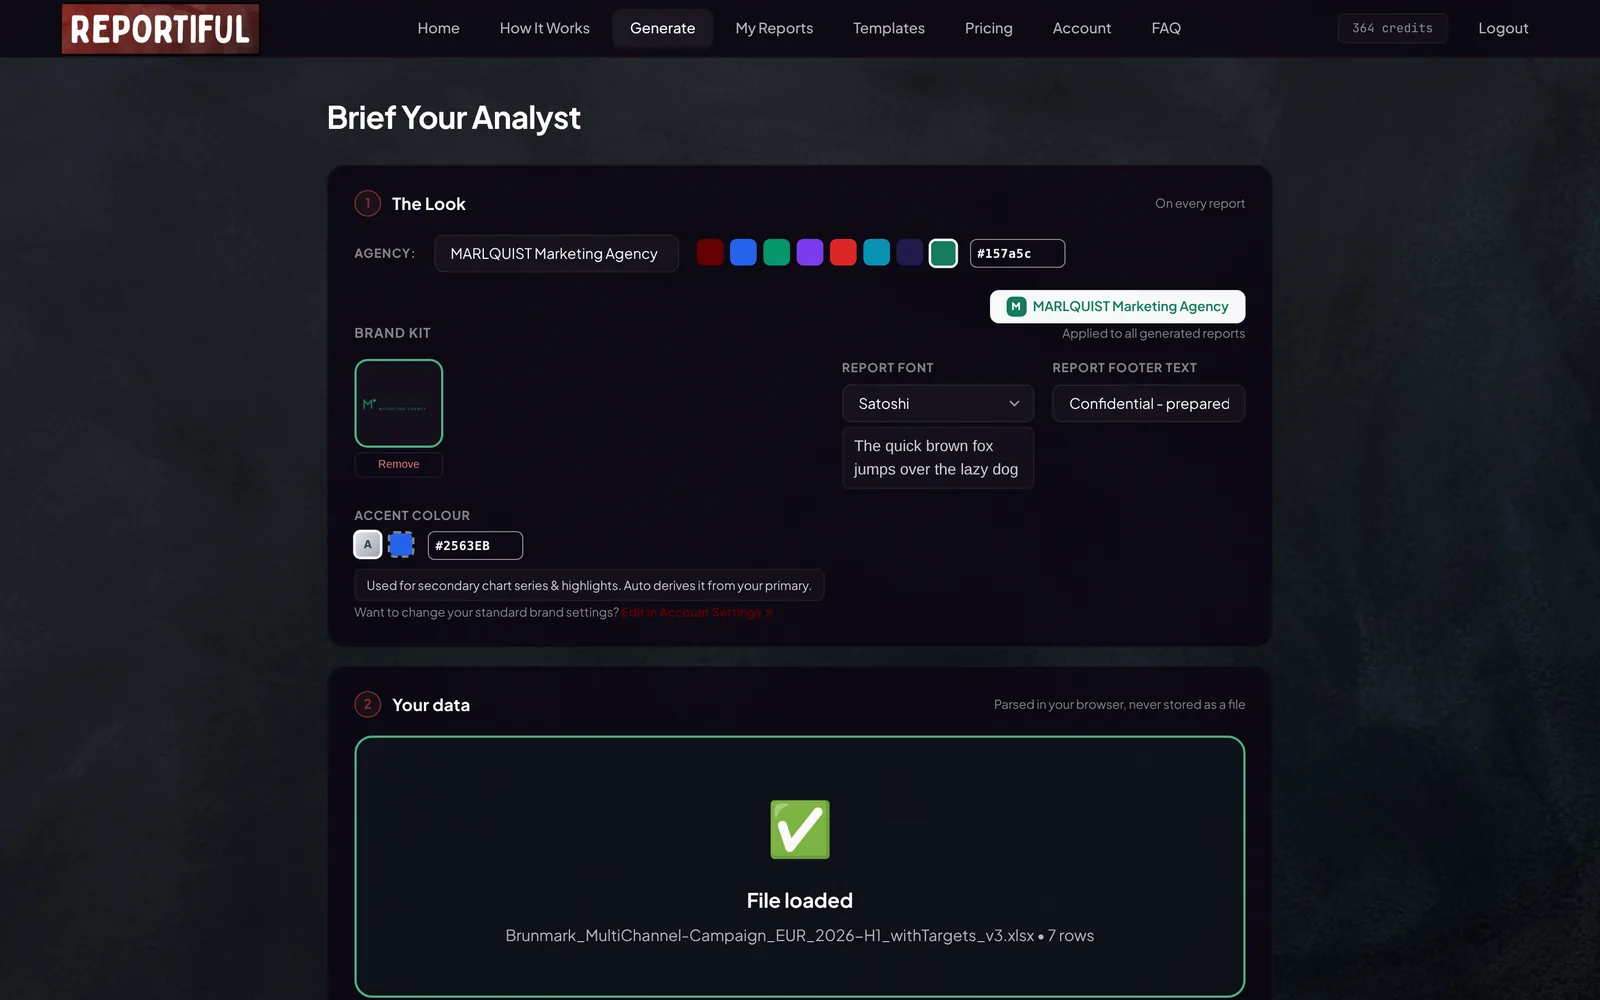
- Open Generate. The page is called Brief Your Analyst. It has three steps: The Look, Your data and The Brief.
- The Look: type your agency name. Otherwise the report carries the sample name Spark Digital Agency. Brand color and logo are optional; you can add them later.
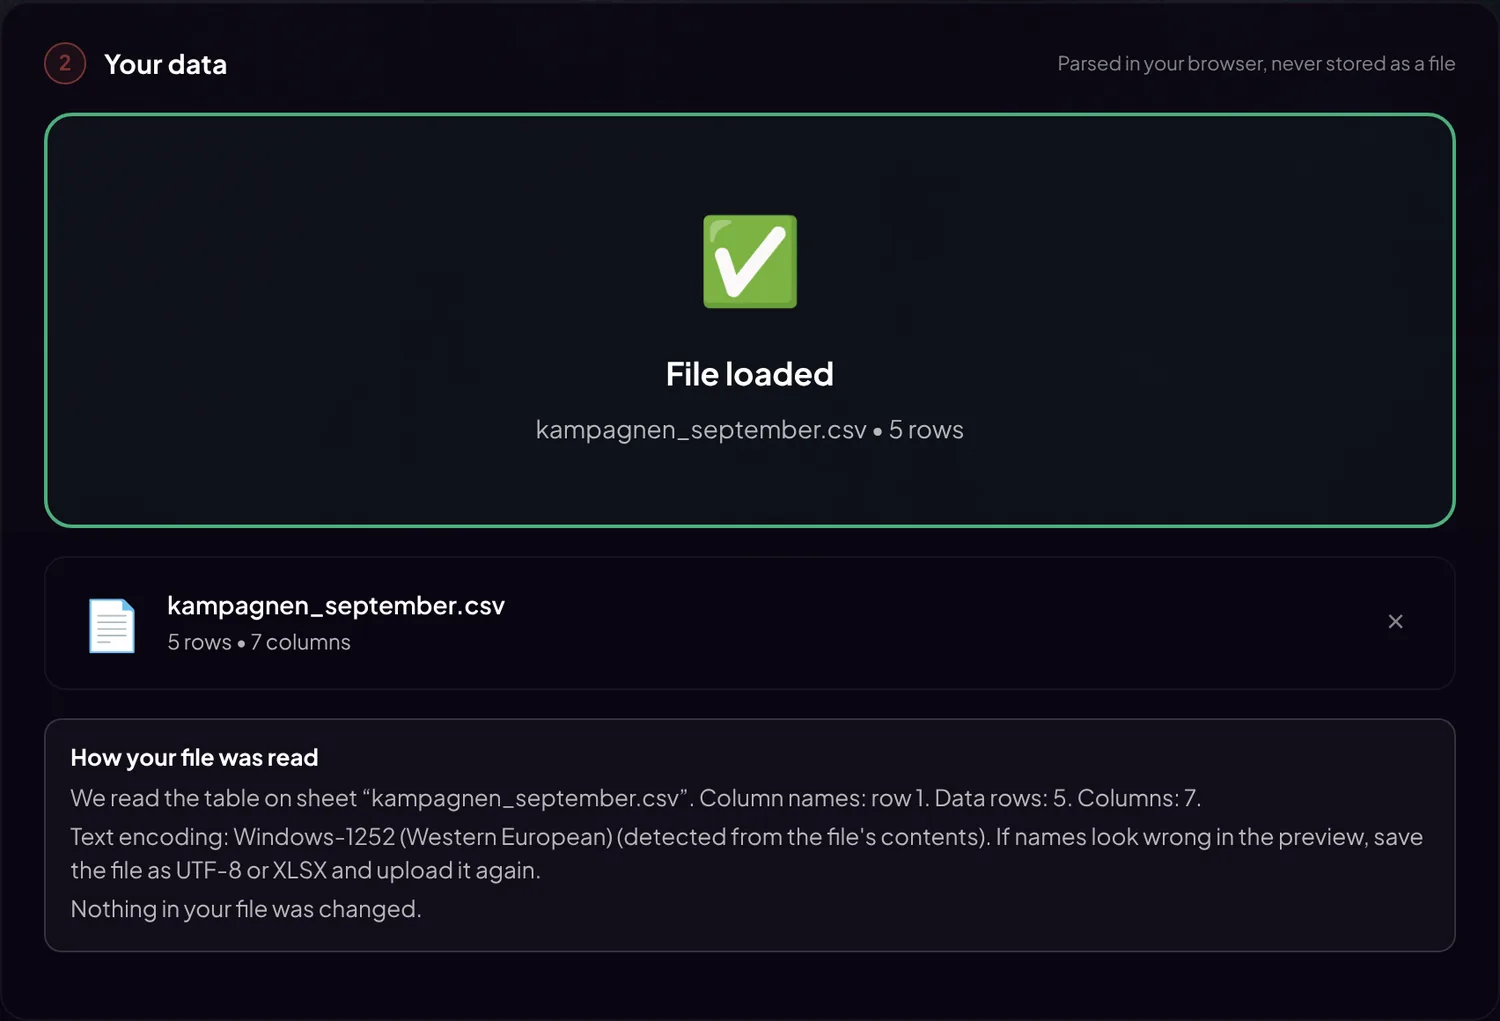
- Your data: drop your file. Drag your file onto the upload area, or click to browse. REPORTIFUL reads it in your browser and shows the number of rows and columns. If parts of the file needed special handling, the panel How your file was read tells you what happened.
- The Brief: check three fields (optional). The Brief appears once your file is loaded. Client Name. Reporting Period, which REPORTIFUL fills in from your dates. Report Type, which REPORTIFUL suggests from your data. For your first report, keep the suggestion.
- Pick a tone (optional). Strategic & Consultative is a good choice for a client report. Leave the sections as they are.
- Start the report. The cost shows next to the button, usually 1 credit. Click Start writing your report. Keep the browser tab open while REPORTIFUL works. You pay only for finished reports: if generation fails, no credit is used.
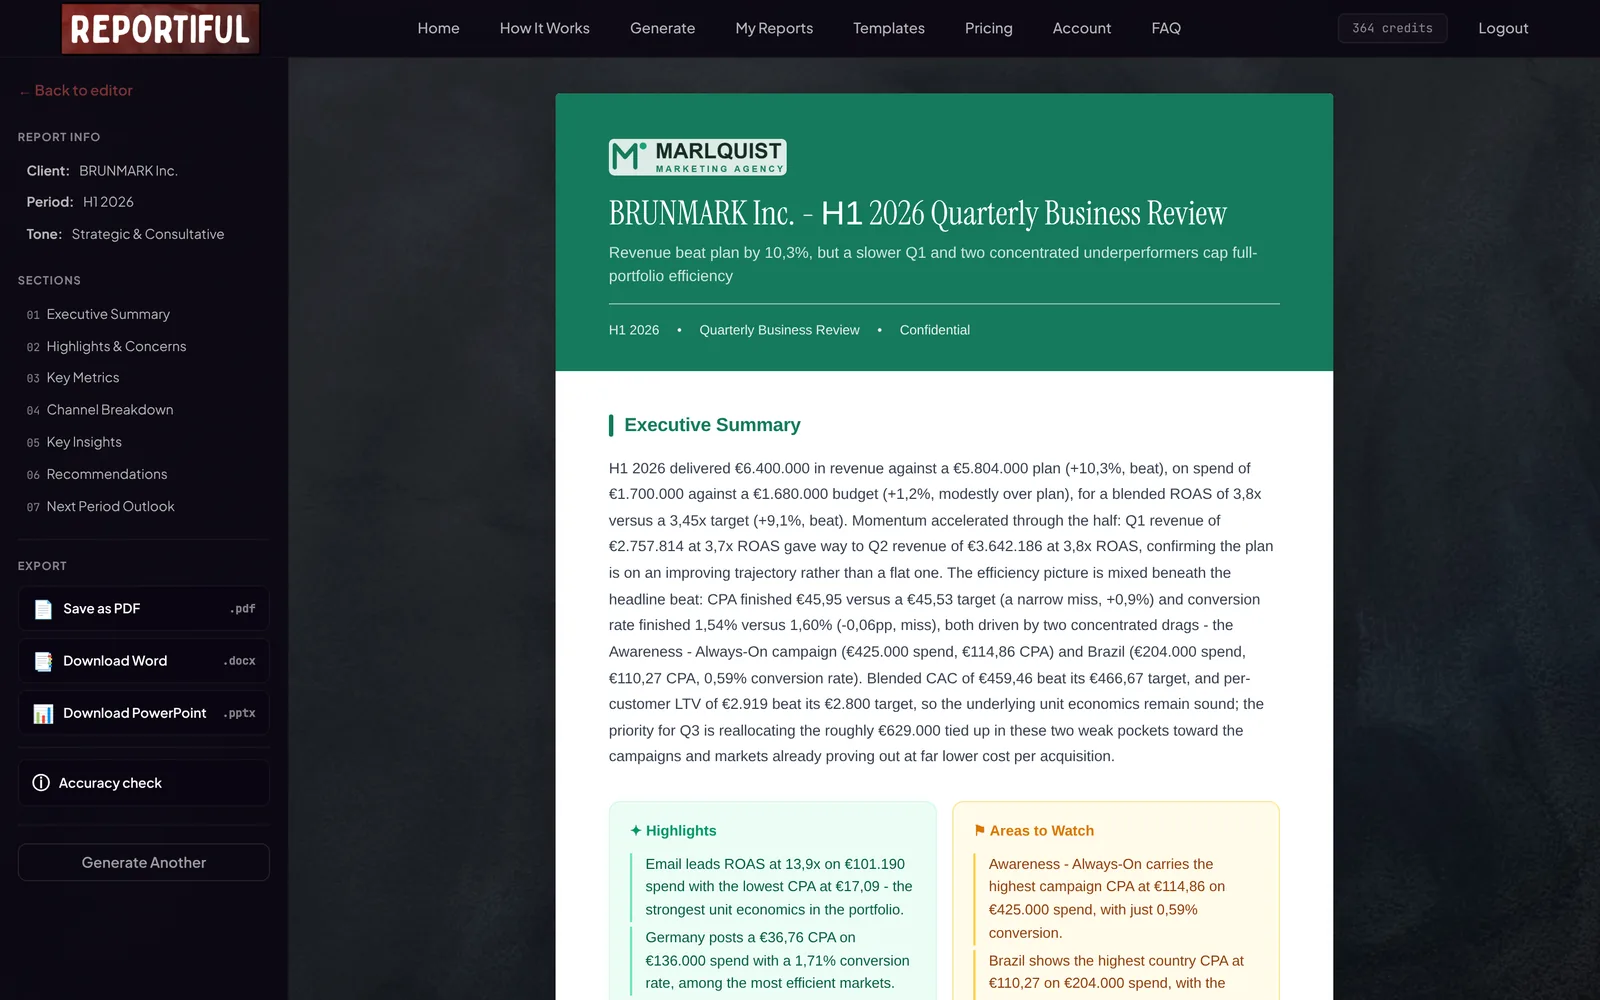
- Review and download. Read the report on screen. Then download it from the left sidebar: Save as PDF, Download Word or Download PowerPoint.
- Read it before you send it. A few minutes of review turn a good report into your report. See chapter 6.
3Prepare your data
REPORTIFUL reads the exports you already have, messy ones included. A few habits make your reports sharper and your monthly routine faster.
What you can upload
| File types | .xlsx, .xls, .csv, .tsv |
| Standard report: 1 credit | Up to 500 rows and 100 columns |
| Larger files | One credit per started block of 500 rows or 100 columns, whichever is higher. Example: 1,200 rows cost 3 credits. |
| Maximum | 100,000 rows, 1,000 columns, 50 MB |
| Files per upload | Up to 5. Each file becomes its own report. |
| Languages and formats | Data in any language. European (1.234,56) and American (1,234.56) number formats both work. |
| Text encodings (CSV, TSV) | CSV files in UTF-8, UTF-16, Shift_JIS, EUC-JP and Windows-1252 are read automatically. If the upload screen names an encoding and the preview looks wrong, save the file as UTF-8 or XLSX. |
When a single file is larger than the standard size, REPORTIFUL asks what to do:
- Process full file. All your data, at the higher credit cost shown.
- Process first 500 rows × 100 columns. 1 credit. Everything beyond is left out of the report.
- Cancel, to go back and upload a different file.
In a batch (several files at once), large files are processed in full, at their credit cost.
What a good file looks like
- One header row with column names, and data rows below it.
- One row per item, for example per day, per campaign or per country.
- At least one breakdown column, such as Channel, Campaign, Country or Segment. This is what the report compares. It also lets the automated accuracy check confirm statements against your data.
- The metrics you want discussed, for example Spend, Impressions, Clicks, Conversions and Revenue.
- Targets, if you have them. Columns such as Target ROAS or Planned Spend are read as targets. The report then compares results against plan.
You do not need ratio columns such as CTR, CPC, CPA or ROAS. REPORTIFUL calculates them from your totals, correctly weighted. If your file has them, that is fine too.
Example of a simple, well-structured file:
| Date | Channel | Campaign | Spend | Impr. | Clicks | Conv. | Revenue |
|---|---|---|---|---|---|---|---|
| 2026-09-01 | Google Ads | Brand Search | 1,240.00 | 18,400 | 1,310 | 64 | 6,820.00 |
| 2026-09-01 | Meta Ads | Autumn Sale | 980.50 | 96,200 | 1,120 | 31 | 3,150.00 |
| 2026-09-01 | Newsletter 36 | 860 | 22 | 2,040.00 |
Messy exports are fine
Real exports come with title rows, notes, subtotals, total rows, hidden sheets and cells like #REF!. In Excel files (.xlsx, .xls) and in CSV / TSV files, REPORTIFUL finds the table, sets aside what is not data, and explains it in the panel How your file was read. Your file itself is never changed.
The panel can tell you, for example, that:
- lines above the table were kept as notes, not as data;
- a sheet was not read because it is hidden, has no table, has only one row, or its name marks it as not current;
- dividers, repeated headers, footer lines and summary rows (subtotals, totals, averages, minimums, maximums, medians and counts) were not counted as data. A row whose numbers are the sum of other rows is read as a total, even without a label;
- your sheet's own total row was not used, because it does not match the rows above it;
- your sheet's own total row is larger than the rows add up to, as in a top-10 list or a filtered export. The report then takes the overall totals from that row;
- a second table starts further down the sheet. Only the first table was read: move the second one to its own sheet;
- rows in a different currency were left out. REPORTIFUL never converts currencies;
- the file has no revenue column, so ROAS and other revenue figures are calculated from a conversion value column, which the panel names;
- two or more columns could be the same metric, for example Net Sales and Gross Sales. REPORTIFUL then uses none of them for that metric: keep one, or rename the others;
- cells with errors were read as empty, and numbers stored as text were read as numbers.
Several platforms in one report
REPORTIFUL writes one report per file. For one report across Google Ads, Meta, LinkedIn and email, put the data in one file.
Recommended: one table with a Channel column. Paste the rows of all platforms under one header row. Fill the Channel column with the platform name, for example Google Ads or Meta Ads. Use the same column name for the same metric on every row: Spend for both Cost and Amount spent. The order of the columns does not matter. Appendix B shows a standard layout. GA4 gets its own place: see "GA4 next to your ad platforms" below.
Workbooks with several tabs work too. REPORTIFUL handles three situations:
| Your tabs | What REPORTIFUL does |
|---|---|
| The same data from different angles, for example By channel, By campaign and By country, with the same totals | Recognized automatically. One tab becomes the main view, the others become extra breakdowns. Nothing is counted twice. |
| The same columns on every tab | The tabs are combined into one table. |
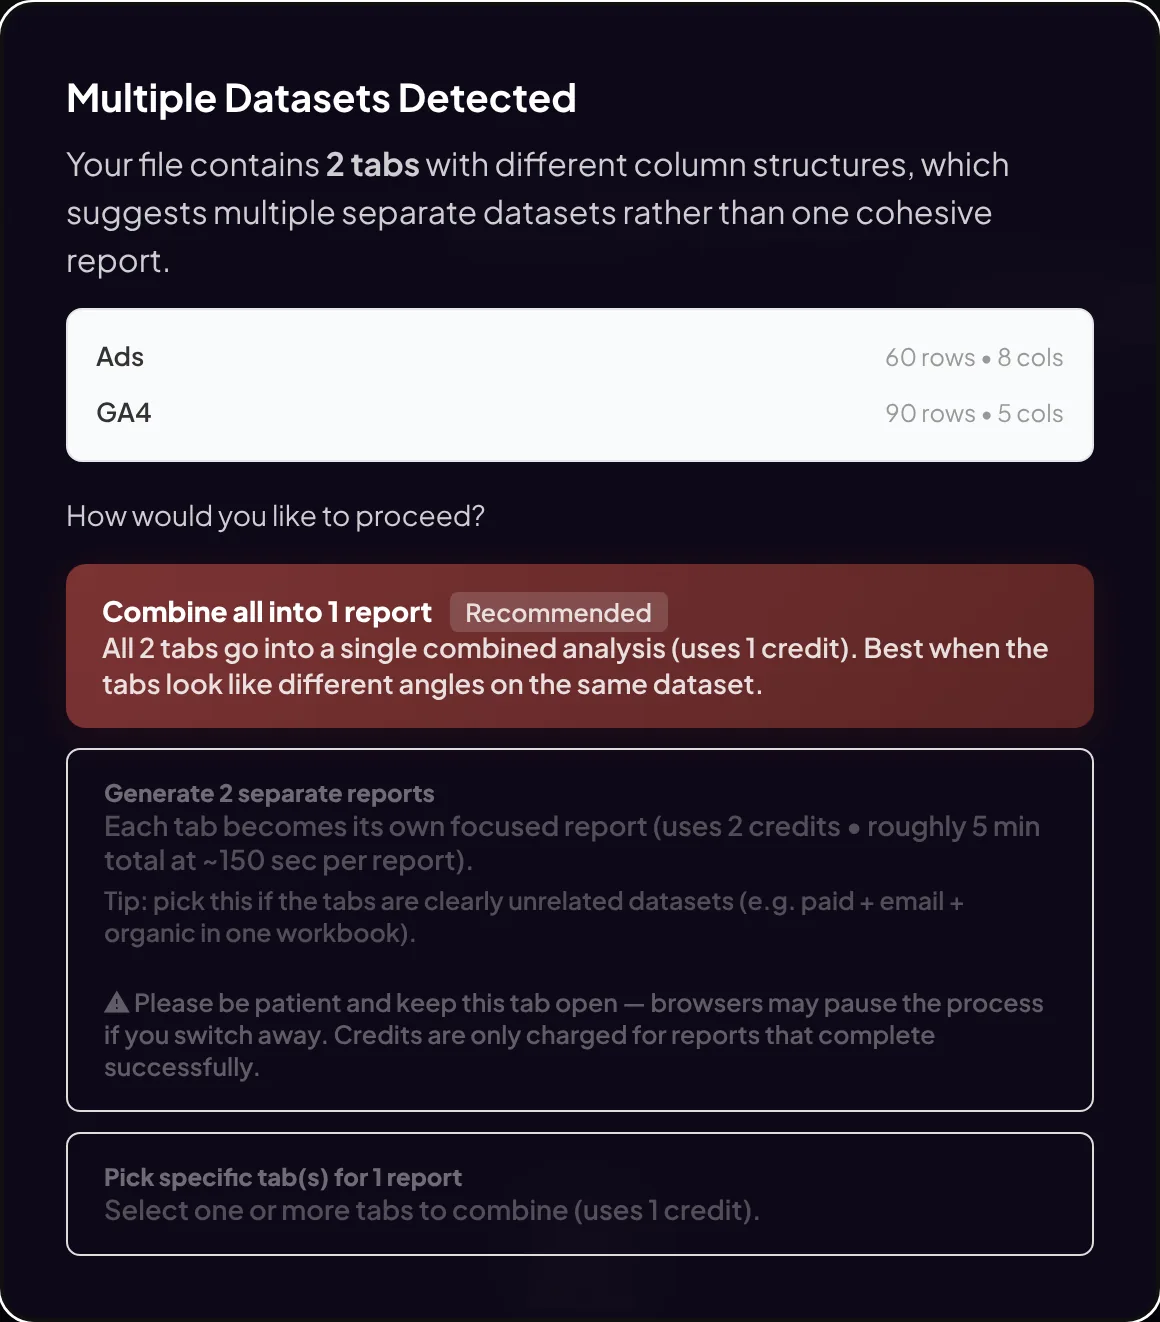
| Different column structures | REPORTIFUL asks you (for a single file). Combine all into 1 report (marked Recommended, 1 credit): the tab with the spend and revenue columns becomes the main data, and the other tabs add context. Generate 2 separate reports (the number matches your tabs): one report per tab, up to 10, one credit each. Pick specific tab(s) for 1 report: only the tabs you tick. |
GA4 next to your ad platforms
GA4 and your ad platforms often count the same customers. To keep every figure right, give GA4 its own place:
- GA4 in its own file. It becomes its own report. This is the simplest way.
- GA4 on its own tab, with its own column names, such as Key events and Total revenue. When REPORTIFUL asks, choose Generate 2 separate reports (one report per tab), or Pick specific tab(s) for 1 report and tick the ad-platform tabs.
Keep GA4's own column names. Renamed to Conversions and Revenue, its figures would be added to the platforms'.
Several files at once (batch)
Drop up to 5 files at once. REPORTIFUL writes one report per file, all with the same settings: the same Client Name, Report Type, tone and branding. Each report costs its own credits. The reports are written one after another, so keep the tab open.
When they are done, switch between the reports in the left sidebar. All Word and All PowerPoint download every report as one .zip file.
- Good for: separate reports for one client, for example one per platform or one per market.
- Not for: one blended report across platforms (put the data in one file instead), or reports for different clients (each needs its own client name and branding).
Periods, currencies and names
- Same period for every source. Pull the same date range from each platform, so comparisons are fair.
- Periods side by side? If your columns are grouped by period under a top header row (for example September and October, each with Spend and Clicks below), REPORTIFUL detects the periods. In the optional settings you then analyze one period or compare them. A plain Date column fills in the Reporting Period instead.
- One currency per report. REPORTIFUL never converts currencies. If a client runs several, convert in your file first.
- Prefer .xlsx when a platform offers it. Numbers and dates arrive as they are. CSV works too; total rows are recognized automatically in both.
- Use the names your client knows. Campaign and channel names appear in the report exactly as they are in your file.
What happens to your data
- Your file is read in your browser. It is never uploaded or stored as a file.
- To write the report, a sample of your data (up to 500 rows) is sent encrypted to our backend. Our AI sub-processor does not use it for training and deletes it within 30 days.
- The finished report is saved in your account, in our EU database in Ireland, for 180 days. Pin it to keep it longer, or delete it at any time.
- You can switch off report history in Account. New reports are then not saved.
Details: Privacy Policy.
4Settings explained
The Generate page has three steps. The Look sets your branding. Your data takes your file. The Brief, which appears once your file is loaded, decides what the report says and how it sounds. This chapter explains every option.
The Look: your branding
| Setting | What it does |
|---|---|
| Agency | Your agency or company name. It appears on the cover and throughout the report. Until you set it, the sample name Spark Digital Agency is used. |
| Brand colour | One of 7 presets, the color picker, or an exact hex code you paste, such as #640000. Used for the cover, headings and charts. REPORTIFUL picks readable text colors for it automatically. |
| Accent colour | A second color for chart series and highlights. With the grey A button (Auto) selected, REPORTIFUL derives it from your brand color. Or paste your own hex code. |
| Logo | Click Upload logo and choose your logo image. It appears on the cover of the Word file, on the title slide in PowerPoint, and at the top of the on-screen report and the PDF. Your agency name appears on every page of the Word file and on every slide. |
| Report Font | 8 fonts: Satoshi, DM Sans, Plus Jakarta Sans, Libre Franklin, Source Sans 3, Merriweather, Lora and Instrument Serif. |
| Report Footer Text | A closing line at the end of the report: the last paragraph in Word, the closing slide in PowerPoint, the last line of the on-screen report and the PDF. For example: Confidential - for internal use only. |
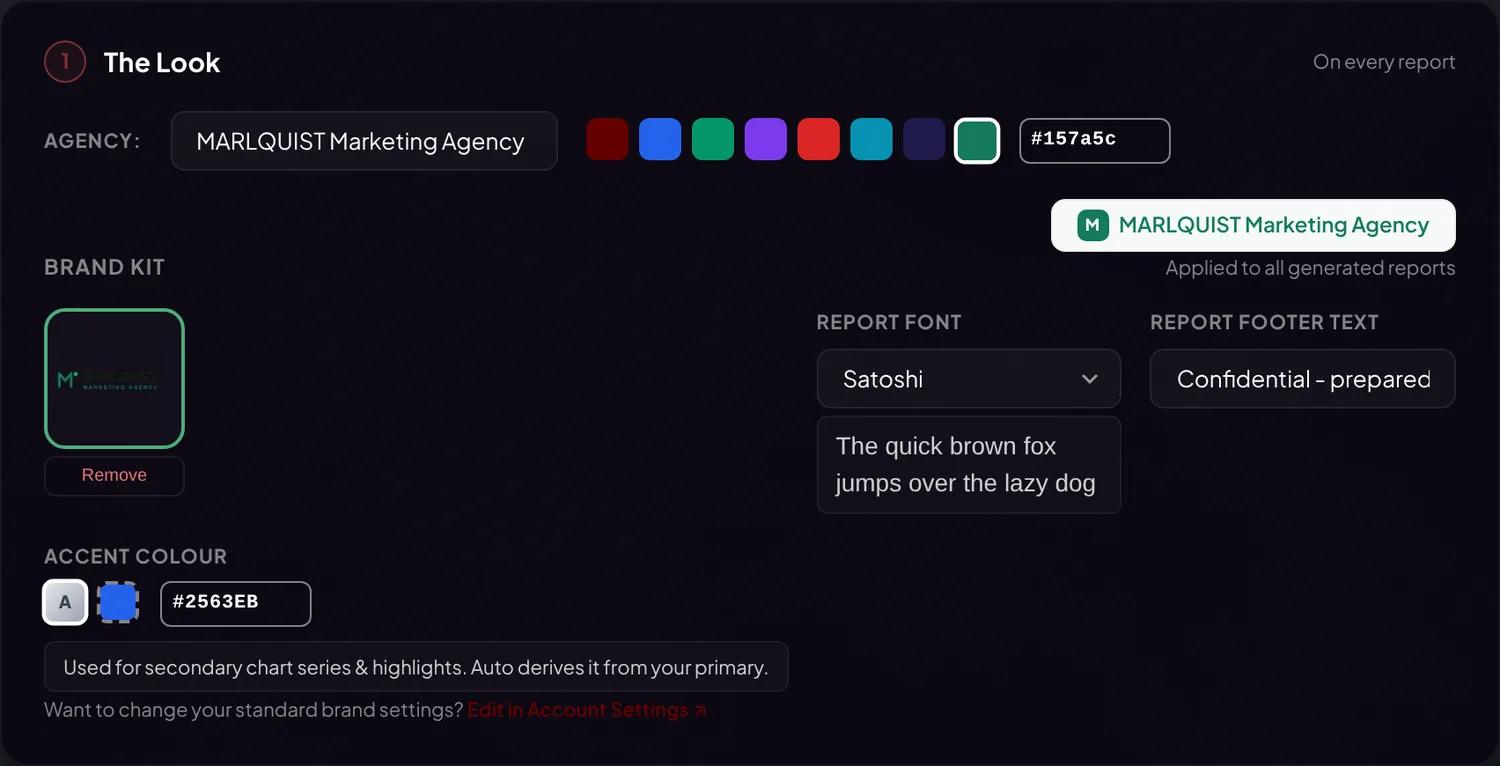
To change your standard branding for all future reports, open Account → Brand Settings. Templates can also store branding, which helps if you work under more than one brand.
The Brief: what to write, and how
| Field | What it does |
|---|---|
| Template | Applies a saved set of tone, sections, instructions and branding. See Templates below. |
| Client Name | Appears on the cover and in the text. |
| Reporting Period | Filled in from your dates. Change the label if you like, for example to Q3 2026, and keep it in line with the data. |
| Report Type | The lens: what the report leads with. Suggested from your data. |
| Report Tone | The voice: how the report is written, and for whom. |
| Report Sections | Which parts the report contains. |
| Further Instructions (optional) | Your own guidance, in plain words. |
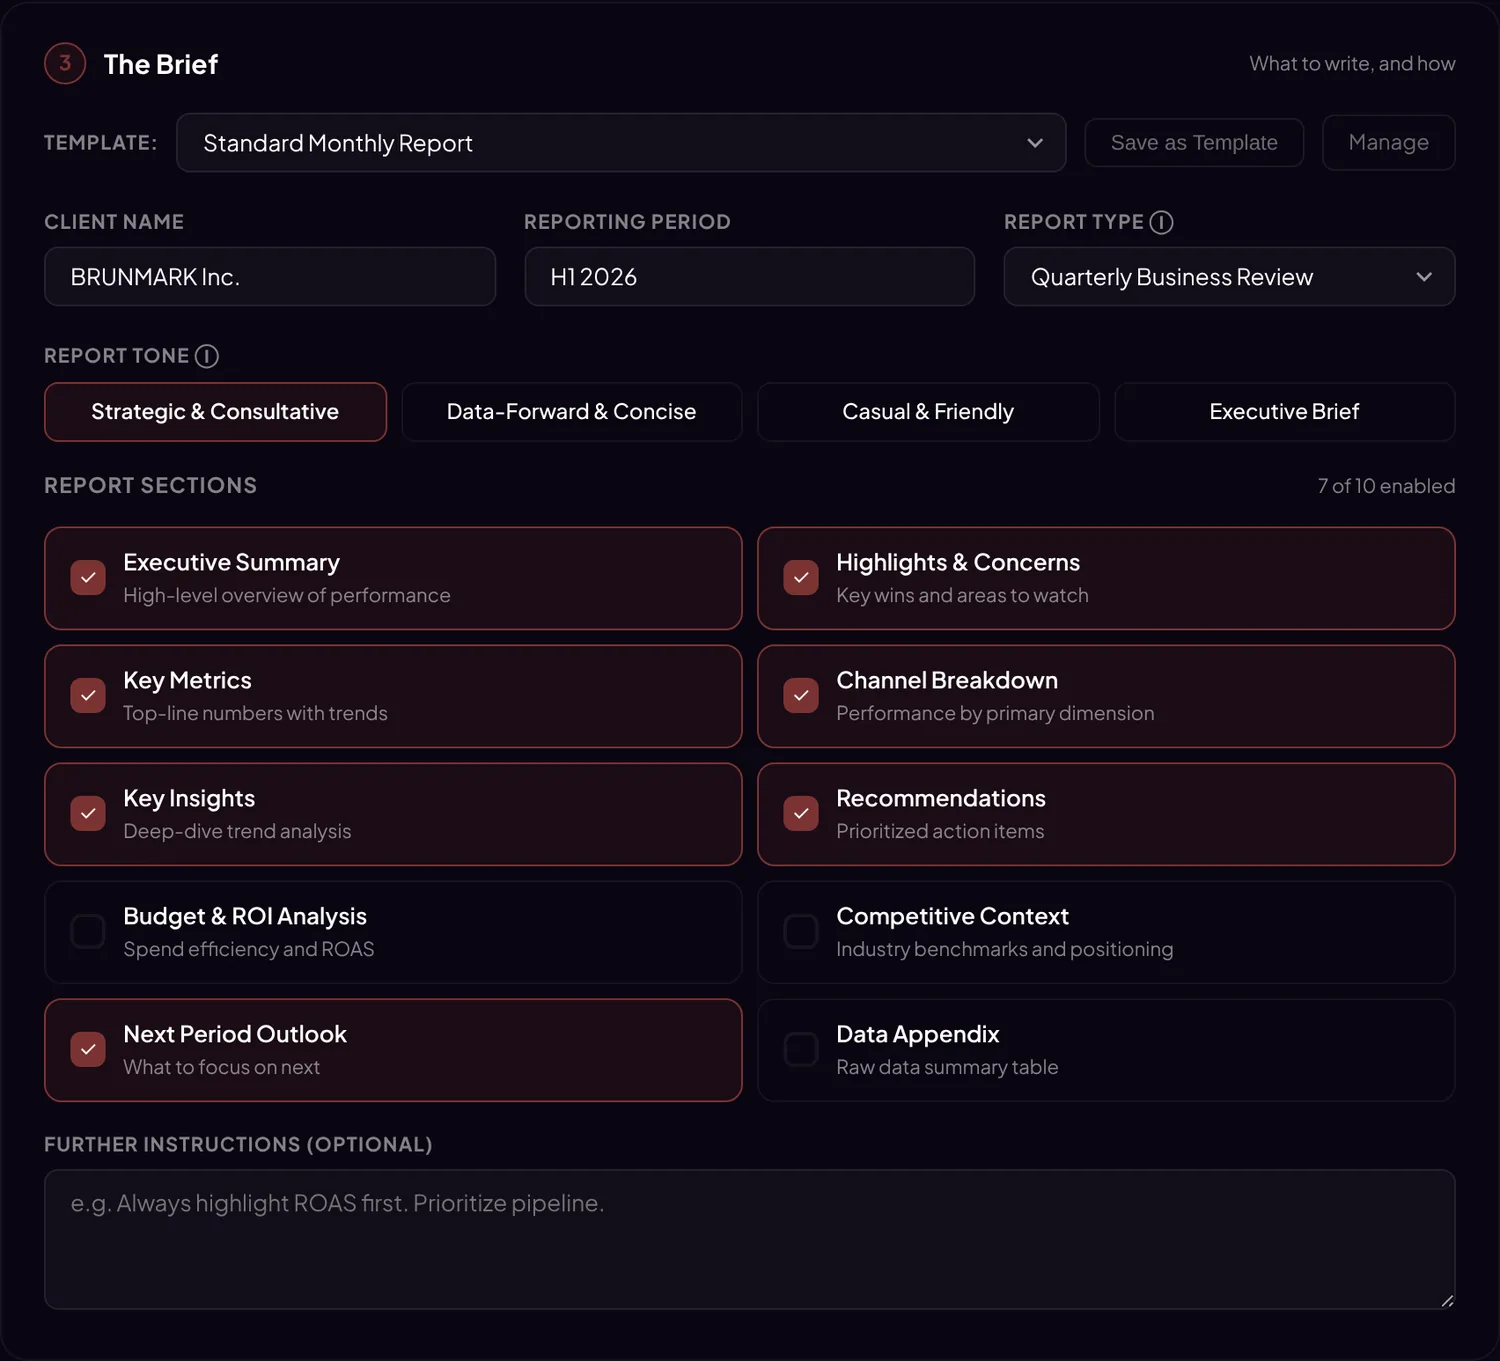
Report Type: the lens
The Report Type decides what the report leads with and which metrics come first. REPORTIFUL suggests a type from your file name, sheet names, columns and first rows. A green hint, Auto-detected from your data, shows that the type was suggested; when REPORTIFUL also recognizes the tool, it adds the tool's name, for example Google Ads export. You can change the type at any time. Your numbers and the credit cost stay the same.
| Report Type | Leads with | Best for |
|---|---|---|
| Monthly Performance Report (default) | Changes since the previous period, and how fast things move | Routine monthly updates across mixed channels |
| Quarterly Business Review | Results against plan and the quarter-over-quarter trend | Quarterly reviews with leadership |
| Campaign Analysis | A clear verdict per campaign: what won, what lost, and by how much | Specific campaigns, CRM and customer journey data |
| Paid Media Report | Paid-only ROAS, CPA and budget efficiency | Paid search and paid social accounts |
| SEO Performance Report | Organic visibility and unpaid traffic | Organic search |
| Social Media Report | Reach, engagement and follower growth | Organic social channels |
| Email Marketing Report | Delivery, opens, clicks and conversions from email | Email campaigns and automated flows |
If your file lacks the metrics a type usually needs, the report works with what is there. It never invents missing figures. In a batch, one Report Type applies to all files.
Report Tone: the voice
| Tone | How it reads | Best for | Length |
|---|---|---|---|
| Strategic & Consultative | A senior consultant. Conclusion first, then the number, then what it means for the business. | Client reports; marketing leads and account teams | The reference |
| Data-Forward & Concise | Numbers first. Short sentences, one idea each. | Analysts and internal teams | About half |
| Casual & Friendly | Warm, plain words. Explains each metric the first time it appears. | Readers outside marketing, such as small-business owners | About the same |
| Executive Brief | Bottom line first. Top 3 insights and top 3 actions, one decision per line. | CEOs, boards and leadership | A quarter to a third |
All tones agree on the findings, the recommendations, their order and the numbers. Only the voice and the length change.
Report Sections
Choose which parts your report contains. Seven of the ten sections are on by default. Some sections carry a different heading in the finished report:
| Section in the picker | Heading in the report | Description in the picker | Default |
|---|---|---|---|
| Executive Summary | Executive Summary | High-level overview of performance | On |
| Highlights & Concerns | Highlights & Areas to Watch | Key wins and areas to watch | On |
| Key Metrics | Key Metrics | Top-line numbers with trends | On |
| Channel Breakdown | Named after your main breakdown, for example Country Breakdown | Performance by primary dimension | On |
| Key Insights | Insights | Deep-dive trend analysis | On |
| Recommendations | Recommendations | Prioritized action items | On |
| Budget & ROI Analysis | Budget & ROI Analysis | Spend efficiency and ROAS | Off |
| Competitive Context | Competitive Context | Industry benchmarks and positioning | Off |
| Next Period Outlook | Looking Ahead | What to focus on next | On |
| Data Appendix | Data Appendix | Raw data summary table | Off |
Budget & ROI Analysis needs spend or cost data. Without it, the section is left out, even when selected.
Further Instructions
A free-text box for what only you know. It shapes emphasis and wording. It does not change your numbers: they come only from your file. Good examples:
- Lead with ROAS. The client judges success on return, not on clicks.
- The client sells B2B software. A conversion is a qualified demo request.
- The budget for next quarter is fixed. Recommend shifts within the current budget.
- A TV campaign ran from 10 to 24 September. It is not in this data. Mention it as context for the traffic peak.
- Say "orders", not "conversions".
- Several paid channels are included. Note that platform-reported conversions may overlap.
Optional settings
Below the Start writing your report button, REPORTIFUL shows optional settings. Most people can skip them.
- Data preview. The first rows of your data, as REPORTIFUL read them.
- Multiple time periods detected. Shown only when your columns are grouped by period. Choose Analyse single period or Compare periods (select at least 2).
- Filter your data. Include or exclude values, for example only some countries or campaigns.
Templates
A template saves your setup, so recurring reports take one click.
- Save as Template (in The Brief) stores your tone, selected sections, Further Instructions, branding (name, colors, logo, font, footer) and the client name.
- The Report Type is not stored. REPORTIFUL suggests it fresh from each file, so check it at each upload.
- Three built-in templates: Standard Monthly Report (Strategic tone, default sections), Executive Brief (1-Page) (Executive Brief tone with Executive Summary, Key Metrics and Recommendations) and Full Deep Dive (Strategic tone, all sections).
- To create, edit, use or delete templates, click Manage next to the template selector, or open Templates in the menu.
Report language
Reports are written in the language of the site you use: English at reportiful.com, Japanese at reportiful.com/ja. Switch with the language link at the bottom of the page. Your data can be in any language.
Combinations that work well
| Combination | What you get |
|---|---|
| Paid Media Report + Executive Brief | A short, ROI-focused summary of ad spend for a CMO |
| Monthly Performance Report + Casual & Friendly | An easy-to-read monthly overview for a non-technical client |
| Campaign Analysis + Data-Forward & Concise | A tight, numbers-led campaign read-out for an internal team |
| Quarterly Business Review + Strategic & Consultative | A quarterly review for leadership, including results against plan |
| SEO Performance Report + Casual & Friendly | An organic search update for a small-business owner, with every metric explained |
5Your finished report
When the report is ready, it opens on screen. From there you check it, download it, and keep it for later.
The report screen
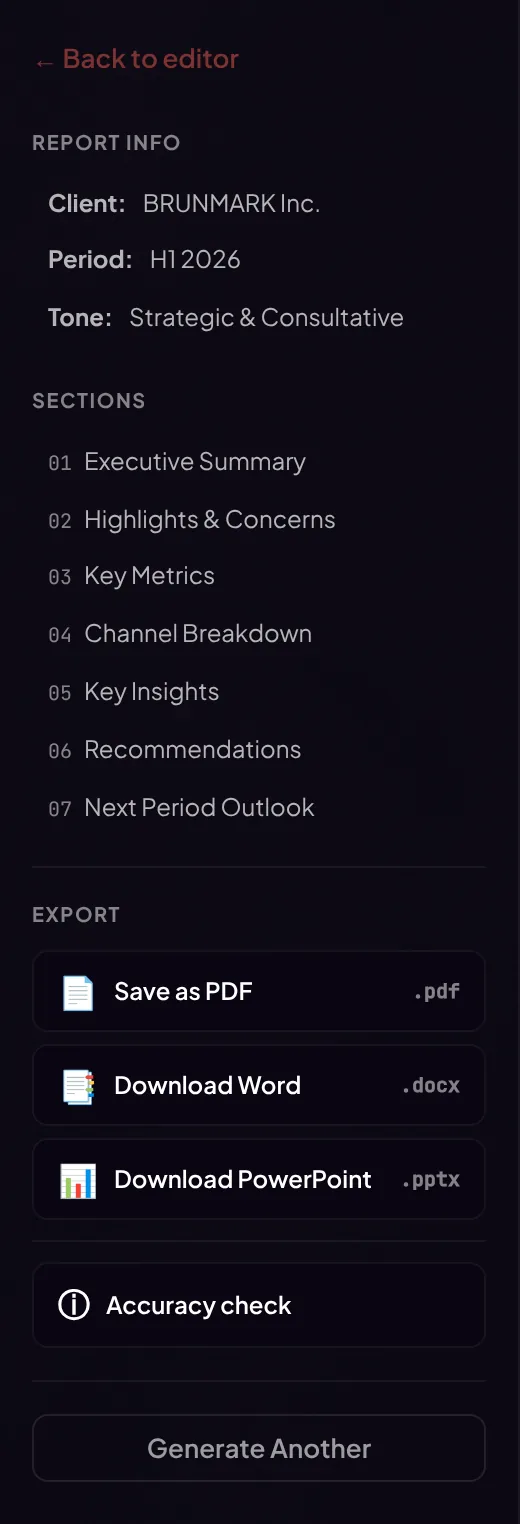
The report appears on the right. The left sidebar holds everything else:
- Report Info: client, period and tone.
- Sections: the parts of your report.
- Export: the download buttons.
- Accuracy check: what the automated check found. Shown when the check ran.
- Generate Another starts a new report. Back to editor, at the top, returns to your settings.
After a batch, the sidebar also lists all reports. Click one to view it.
The automated accuracy check
Every report is checked against your data before you see it. A statement that cannot be confirmed is removed. Nothing is rewritten. Open Accuracy check in the sidebar to see what was removed and why.
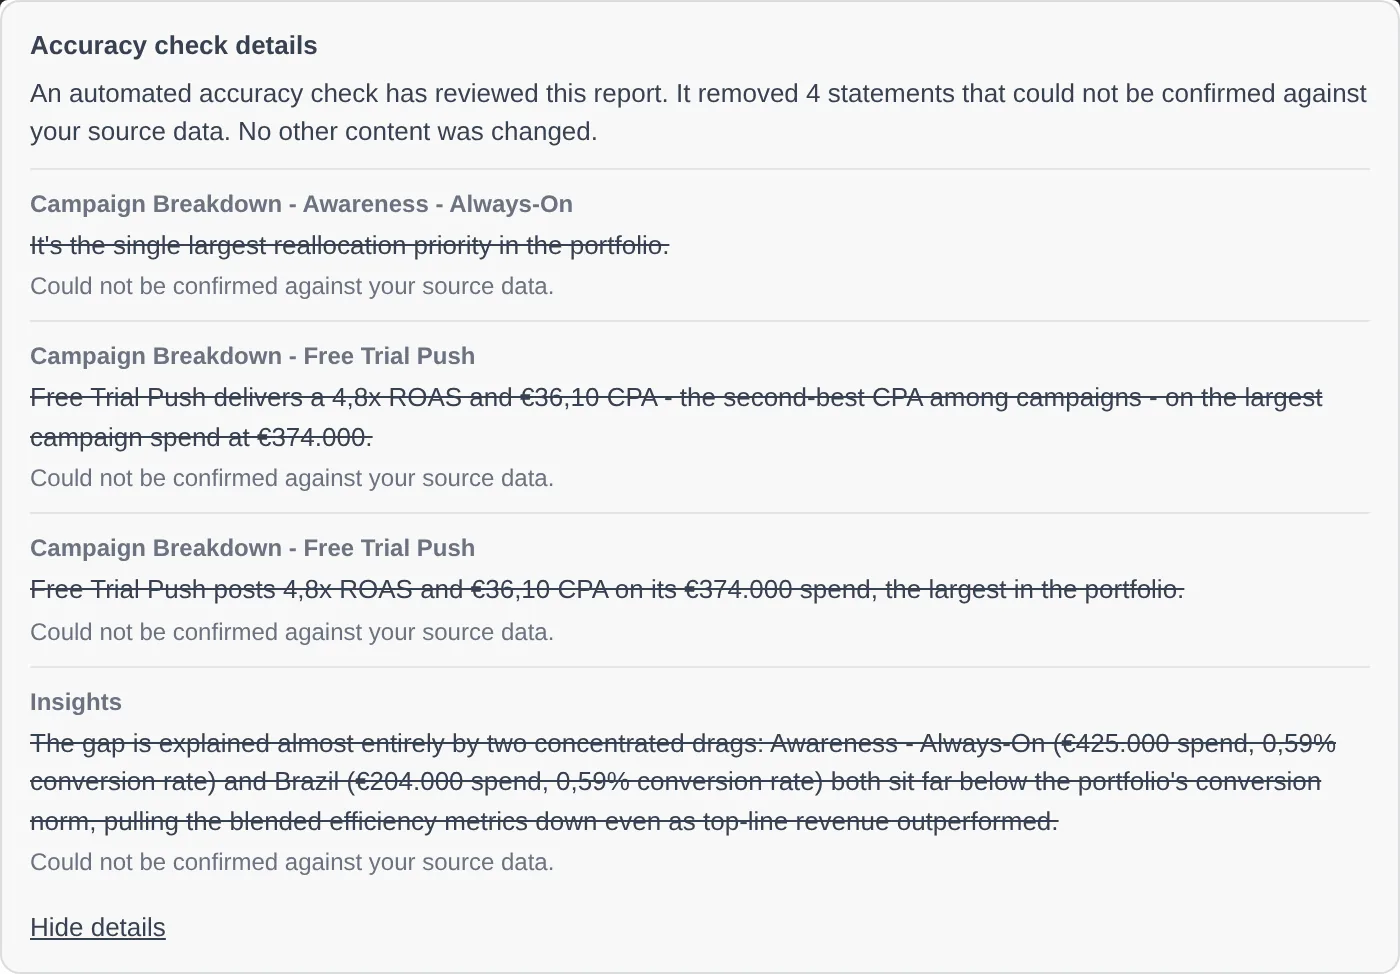
In some cases the check cannot run, for example when it cannot read the structure of a file. The report then shows a notice at the top. The figures in that report were not verified: check them before you share the report.
Currency check. REPORTIFUL also checks that the amounts in the report are written in your file's currency. If it finds another currency, it writes the report once more when time allows. If a mismatch remains, the report opens with a notice at the top: check every money figure before you share the report. The notice appears on screen only, not in the downloads.
Download formats
| Button | You get | Good to know |
|---|---|---|
| Save as PDF | A PDF, built in your browser | A4, or US Letter where that is the standard paper size. In Safari and on iPhone or iPad, your browser's print dialog opens instead: choose Save as PDF there. |
| Download Word | .docx | Fully editable. Also opens in Google Docs and Pages. |
| Download PowerPoint | .pptx | Fully editable. Also opens in Google Slides and Keynote. |
| All Word / All PowerPoint | .zip | After a batch: every report in one download. |
AI-content marking. REPORTIFUL is a dedicated reporting engine with its own marketing knowledge base, and parts of the work are AI-supported. That is why Word and PowerPoint files, and PDFs built by REPORTIFUL, carry a machine-readable note in their file properties saying that the content is AI-generated (EU AI Act, Article 50(2)); the note names REPORTIFUL as the system. There is no visible label, and your branding is not affected. A PDF made through the print dialog carries no such note.
My Reports
- Every report is saved in My Reports for 180 days.
- Pin a report to keep it longer. Pinned reports do not expire.
- Open a saved report to view and download it again. Delete removes it.
- Report history can be switched off in Account. New reports are then not saved, so download them right away. Reports you already saved are kept, but My Reports shows them only while history is on.
Credits
- A standard report costs 1 credit. Larger files cost more (chapter 3). The exact cost shows before you start.
- Credits are charged only when a report completes.
- New accounts get 3 free reports. Pack credits never expire.
- Buy prepaid credit packs, or start a monthly plan, on the Pricing page. Plan credits renew every month; unused ones roll over for one month while the plan is active.
- A second version in another tone is a new report and uses credits like any other.
Account settings
- Brand Settings: your standard branding for all reports.
- Change Password, and Two-Factor Authentication with an authenticator app.
- Report History: on or off.
- Export My Data: your profile and report history as a JSON file.
- Request Account Deletion.
6Before you send: make the report yours
REPORTIFUL knows your data. You know your client. The best reports combine both. Plan about 10 to 30 minutes per report for this step: it is the part your client values most.
Why this step matters
REPORTIFUL calculates every figure from your file and checks its statements against your data. What it cannot see is everything outside the file: your client's goals, last month's conversation, the promotion in week two, the tracking change on the website. Automatically written text can read a trend correctly and still miss the reason behind it. Your review turns a correct report into the right report.
Double-check before you send
- The cover is right: client name, period and logo.
- The Reporting Period is the one you want. It is pre-filled from your data; adjust the label if needed.
- Three headline figures match your source, for example total spend, conversions and ROAS.
- The accuracy check result in the sidebar. If a notice says the figures were not verified, check every figure you will discuss.
- Names are the ones your client uses: campaigns, channels, products.
- Every comparison holds. "Highest", "lowest", "doubled", "best channel": read each one against the numbers.
- Recommendations fit the client: budget, contract scope, brand rules, plans already agreed.
- Competitive Context (if selected) fits the client's market. It draws on general industry knowledge, not on your file.
- Nothing contradicts what you told the client last time.
- The tone fits the reader.
- The file contained only this client's data.
Add what the data cannot see
Your export knows what happened. It does not know why. Add the context only you have:
| What to add | Examples |
|---|---|
| Project context | Launches, promotions, price changes, stock outages, website or tracking changes, budget changes during the month |
| Outside factors | Seasonality, holidays, TV or print, events, PR, competitor moves, market news |
| Your observations | What you noticed in the accounts, tests you ran, what the client said in your last meeting |
| Decisions already made | Agreed next steps, so the recommendations build on them |
| Your judgment | Which recommendation you would do first, and why |
Where to add it
Before you generate: Further Instructions
Tell REPORTIFUL the context in a few sentences. The report then weaves it into the narrative. For example:
- The website relaunch on 15 September broke conversion tracking for two days. Mention it where the data dips.
- The client paused LinkedIn in week 3 on purpose, to test how sales react.
- This month the client's priority is new customers, not repeat sales.
After you generate: edit in Word or PowerPoint
- Add one or two sentences of your own view to the Executive Summary.
- Add a slide or paragraph such as "Our view" or "What we do next".
- Re-order or adjust recommendations to match what you agreed with the client.
- Add short comments under charts where the client will have questions.
- Delete what does not help this reader.
One report, two audiences
Send the Executive Brief to your client's CMO and the Strategic & Consultative version to their marketing team. Both share the same findings and the same order of recommendations. To make the second version, generate the same file again with the other tone. Each version is a separate report.
It goes out under your name
- Read every report before you send it. That is good practice for any AI-assisted document.
- Give the file your own name before you send it: downloaded file names start with REPORTIFUL_.
- If your client contracts require you to disclose AI assistance, the machine-readable marking in the files supports this.
- Found a systematic issue? Tell us through the contact form.
7The reporting workflow: exports, not connections
REPORTIFUL works from the exports you already have. No API connection, no logins, no connectors. This chapter shows why that is an advantage, and how to set up a routine where the data work takes about 5 minutes per client.
Why REPORTIFUL works from your exports
REPORTIFUL does not connect to your ad or analytics accounts. We decided this on purpose, because for an agency it is the better setup:
| Your client's accounts stay closed. | REPORTIFUL never asks for logins or access tokens, and stores none. There is nothing to leak and nothing for your client's security team to review. Who has access to the ad accounts? Only you. |
| You control what goes in. | You choose the accounts, campaigns and period. No half-synced day, no stray test campaign, no surprise data. |
| Numbers you can stand behind. | Platforms change metric definitions and interfaces often. A live connection inherits each change without telling you. An export is exactly what the platform shows you today. REPORTIFUL reports exactly that, and you review it before it goes out. |
| Works with every tool. | If it exports a spreadsheet, REPORTIFUL can read it: large platforms, regional networks, CRM and email tools, your own Excel models. You never wait for a connector. |
And your file stays with you: it is read in your browser and never stored as a file.
Is uploading slower?
Barely. Most platforms can email you their export on a schedule, for free. The data comes to you; you collect it and drop it in. Your routine becomes about 5 minutes of data handling, followed by your review. That review is the part you would not want to automate anyway.
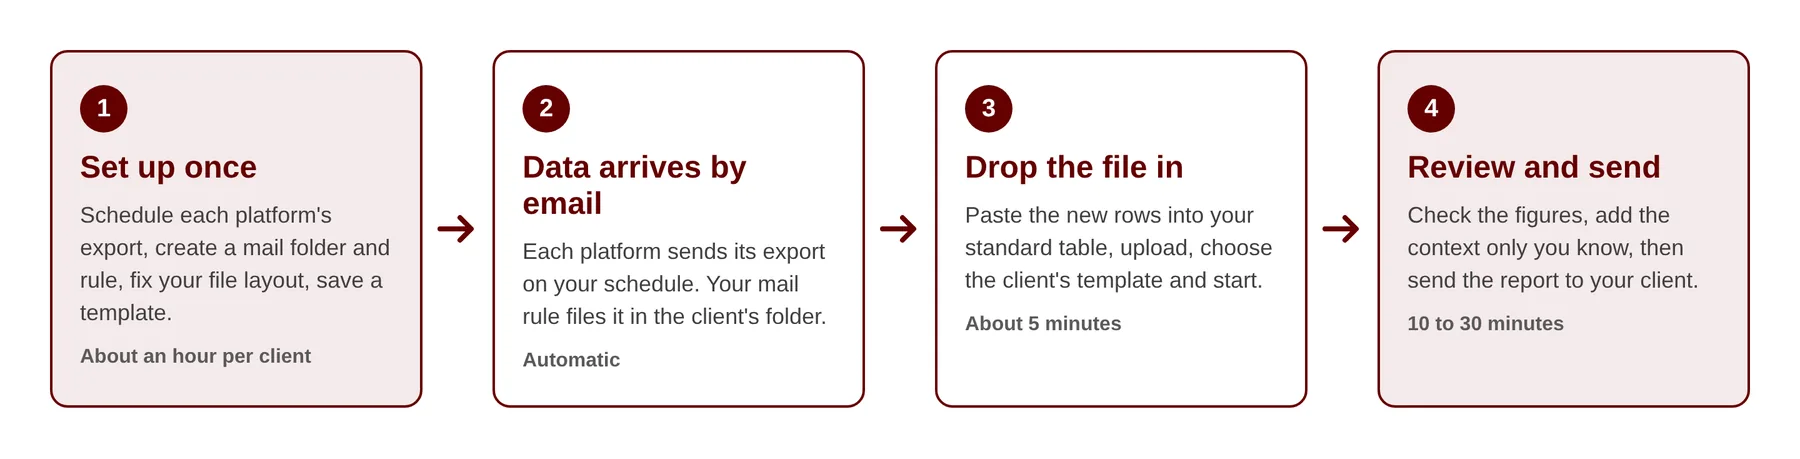
Set up once: about an hour per client
- Choose a path for each platform. See the table below. Most agencies mix: scheduled exports for most platforms, a quick manual export for the rest.
- Schedule the exports. Set each platform to send its report on your reporting cadence. Appendix A shows where. Choose a send date after the data has settled, for example the 4th of the month for monthly reports.
- Collect them automatically. Create one mail folder per client and an email rule that files each platform's report into it.
- Fix your file layout. Decide how the client's file looks and keep it the same every month. For a blended report, use one table with a Channel column (Appendix B). Set up each platform's report with its columns in the same order as your table. Then the monthly paste is a copy of rows, nothing more.
- Save a template per client. Generate the first report the way you want it, then click Save as Template: branding, tone, sections and instructions.
| Path | How it works | Cost | Best for |
|---|---|---|---|
| A Scheduled exports (recommended) | Each platform emails its export on your schedule. GA4, Google Ads, Microsoft Advertising, Meta, TikTok, LINEヤフー広告, HubSpot and Klaviyo offer this. | Free | Most agencies |
| B Connector sheet | A connector tool you already use, for example Supermetrics or Windsor.ai, writes all platforms into one Google Sheet on a schedule. You download the sheet and upload it. | Paid connector subscription | Many clients and platforms |
| C Manual export | Export each platform by hand each cycle: about 2 to 3 minutes per platform. | Free | Starting today; platforms without scheduling, such as LinkedIn, LINE広告 and Mailchimp |
Your routine each cycle
- Collect the new exports: from the client's mail folder, the connector sheet, or quick manual exports.
- Prepare the client file: paste the new rows into your standard table and fill in the Channel column. GA4 stays in its own file or tab (chapter 3). Want one report per platform instead? Skip this step and upload the exports as they are, up to 5 at once.
- Upload and choose the client's template. Check the Report Type and the Reporting Period.
- Glance at How your file was read, if it appears, then start the report.
- Review and enrich the report (chapter 6).
- Send it to your client.
Steps 1 to 4 take about 5 minutes. The review takes 10 to 30 minutes, depending on how much of your own context you add. That is where your expertise shows.
Frequently asked questions
Will REPORTIFUL connect directly to my ad accounts?
Not today, and on purpose, for the reasons above. Scheduled exports, or a connector tool you control, give you automation without handing account access to another service.
My client wants a live dashboard. Do I still need this?
Use both. Dashboards monitor performance day to day. REPORTIFUL explains it: what happened, why, and what to do next, in a document your client can forward.
How do I handle many clients?
One template and one mail folder per client. Generate the reports one after another; each takes 2 to 3 minutes.
Can I combine several platforms in one report?
Yes, in one file. See "Several platforms in one report" in chapter 3.
8Tips for better reports
Small changes to your file and your brief make a clear difference. Ten habits of agencies that get the most out of REPORTIFUL.
- Decide who reads it, then pick the tone. A CMO and an account manager need different reports.
- Add targets to your file. With columns such as Target ROAS or Planned Spend, the report compares results against plan.
- Give the report something to compare. A breakdown column such as Channel, Campaign or Country turns numbers into insight. Tabs that show the same data by channel, by campaign and by country add more angles.
- Include the previous period. With more than one period in the file, the report can show change and momentum.
- Keep one currency and one period per report.
- Use the names your client uses. The report repeats campaign and channel names exactly as they appear in your file.
- Context in Further Instructions, figures in the file.
- Select fewer sections for busy readers. A focused report gets read.
- Make two versions for two audiences. Executive Brief for leadership, Strategic & Consultative for the team.
- Read before you send. Always.
9Troubleshooting
Most problems have a quick fix. If yours is not here, write to us through the contact form. We usually reply within one business day.
| What you see | What it means | What to do |
|---|---|---|
| Data not recognised | The file did not look like marketing, business or analytics data. | Upload the sheet that holds your data, with a header row. |
| We could not find a table in this file | There is no row of column names with data rows below it. | Check the file and upload it again. |
| Large File Detected | More than 500 rows or 100 columns. | Choose the full file (more credits), the first 500 rows × 100 columns (1 credit), or a smaller file. |
| Multiple Datasets Detected | Your workbook has tabs with different structures. | Combine them into 1 report, generate separate reports, or pick tabs. Combine uses the first 50 rows of the extra tabs as context, so for a GA4 tab choose separate reports or pick the ad tabs (chapter 3). |
| Too many rows, Too many columns or File too large | Above 100,000 rows, 1,000 columns or 50 MB. The message appears under the title Unable to generate report. | Split the file, or remove what you do not need. |
| Service temporarily busy | High demand at the moment. | Wait a moment and try again. No credit is used. |
| Unable to generate report | The report could not be completed, or the file could not be used. The line below the title says why. | Try again, or fix the file as the message says. No credit was charged. If it happens again, contact support. |
| A notice at the top of the report: the automated check did not finish, or could not read the file's structure | The figures were not verified against your data. | Check the figures before you share the report. A breakdown column such as Channel or Campaign often helps next time. |
| A notice at the top of the report: the currency may not match your data | Some amounts in the report are written in a different currency than your file. | Check every money figure before you share the report, and correct it in the Word or PowerPoint file. A currency in your column names, for example Spend (EUR), helps next time. |
| Budget & ROI Analysis is missing | Your file has no spend or cost column. | Add spend data, or leave the section off. |
| Save as PDF opens the print dialog | Safari, iPhone or iPad, or the PDF could not be built. | Choose Save as PDF in the dialog. This PDF carries no AI marking in its properties. |
| In How your file was read: Text encoding: and a name, for example Shift_JIS (Japanese) or Windows-1252 (Western European) | Your CSV file is not saved as UTF-8. REPORTIFUL worked out its text encoding and read it that way. | Check the names in the data preview. If they look wrong, save the file as UTF-8 or XLSX and upload it again. |
| This file contains damaged characters | Some characters were already broken before the upload (shown as �), usually because the file was once saved in the wrong text encoding. | Export the file again from its source. |
| We could not read the text in this file | The file uses a text encoding REPORTIFUL cannot read (it reads UTF-8, UTF-16, Shift_JIS, EUC-JP and Windows-1252), or it is not a text file. | Save it as "CSV UTF-8" or as XLSX and upload it again. |
| The Reporting Period is empty or does not fit | In a CSV file the dates are in a format REPORTIFUL does not pre-fill from, such as 01.09.2026 or 2026年9月1日, or are written day first (01/09/2026). Or another column, such as Week 36, was taken for the dates. | Type the period you want. Excel date cells always work; in CSV files 2026-09-01 is the safest format. |
| Maximum 5 files allowed. | You chose more than 5 files at once. None of them was read. | Choose up to 5 files, and upload the rest as a second batch. |
| In a batch, a workbook was reduced to one tab | A batch runs without questions. For a workbook whose tabs have different structures, REPORTIFUL uses the main tab. | Upload that workbook on its own to choose how its tabs are used. |
| The report is in the wrong language | Reports follow the site language. | Use reportiful.com for English, reportiful.com/ja for Japanese. |
| You're out of credits | All credits are used. | Buy a credit pack on the Pricing page. |
| Verify your identity to unlock 3 free credits | You signed up with a free email address. | Enter your company website URL. |
| A report is missing from My Reports | Reports expire after 180 days unless pinned, or report history is off. | Pin reports you need longer. Download copies you want to archive. |
Appendix AExport recipes by platform
Where to find scheduled exports, and which columns to use. Checked against the vendors' help pages on 5 October 2026. Platforms change their menus often. If a menu looks different, search the platform's help for "scheduled report" (in Japanese: スケジュール).
At a glance
| Platform | Scheduled export | Formats | Watch out for |
|---|---|---|---|
| Google Analytics 4 | Yes, by email | CSV or PDF | Administrator role. Schedules stop after 1 to 12 months: renew them. Data can take up to 72 hours to settle. |
| Google Ads | Yes, by email | CSV, TSV, XLSX and others | Recipients need access to the account. |
| Microsoft Advertising | Yes, by email | CSV or TSV (zipped), XLSX | Monthly schedules run on day 1 to 28. |
| Meta Ads Manager | Yes, by email | XLSX or CSV (manual export) | Single-account reports only. Recipients need access to the ad account. |
| LinkedIn Campaign Manager | No: export by hand | CSV | Level names changed from October 2025. |
| TikTok Ads Manager | Yes, by email | Chosen in the schedule | Up to 5 recipients. Cancelled after 3 months without a download. |
| LINEヤフー広告 検索広告 | Yes: email notice, then download | CSV, TSV, Excel用CSV, XML | Both 「CSV」 and 「Excel用CSV」 work. |
| LINEヤフー広告 ディスプレイ広告 | Yes: email notice, then download | CSV or TSV | Console redesign on 20 October 2026. |
| LINE広告 (legacy) | No: export by hand | CSV | Ads stop on 26 October 2026. Reports disappear around the end of March 2027. |
| HubSpot | Yes, recurring report emails | CSV, XLS, XLSX (some report types) | Recurring emails go to HubSpot users only. |
| Mailchimp | No: export by hand | CSV | - |
| Klaviyo | Yes (Custom Reports) | CSV, via a download link | Sent only to the person who set it up. |
Column names by platform
You only need this when you combine several platforms in one table (chapter 3). For a single-platform report, upload the export as it is: REPORTIFUL reads the platform's own column names, including the Japanese ones of Google Ads, Meta, TikTok and LINEヤフー広告. Where a name needs changing, the platform's section below says so. Names below are as they appear in English interfaces and can differ slightly with your account language and report setup.
| Your column | Google Ads | Meta Ads | LinkedIn Ads | TikTok Ads |
|---|---|---|---|---|
| Date | Day | Day (Breakdown → By time → Day) | The date column (Time breakdown: Daily) | The date column |
| Channel | Add: Google Ads | Add: Meta Ads | Add: LinkedIn Ads | Add: TikTok Ads |
| Campaign | Campaign | Campaign name | Campaign name, or Ad set name | Campaign name |
| Impressions | Impr. | Impressions | Impressions | Impressions |
| Clicks | Clicks | Link clicks | Clicks | Clicks (destination) |
| Spend | Cost | Amount spent (with currency code) | Spent | Cost |
| Conversions | Conversions | Purchases, or your specific result | Conversions | Conversions |
| Revenue | Conv. value | Purchases conversion value | Total conversion value | Payment completion value (page) |
GA4 stays out of this table. It counts many of the same conversions as the platforms, so keep it in its own file or on its own tab, with its own column names (chapter 3).
Japanese platforms:
| Your column | LINEヤフー広告 (検索広告 and ディスプレイ広告) | LINE広告 (legacy) |
|---|---|---|
| Date | 日 (add it under 分割項目) | The date column (集計間隔: 日別) |
| Channel | Add: LINEヤフー広告 検索 / LINEヤフー広告 ディスプレイ | Add: LINE広告 |
| Campaign | キャンペーン名 | The campaign name column |
| Impressions | インプレッション数 | Impressions |
| Clicks | クリック数 | Clicks |
| Spend | コスト | Cost |
| Conversions | コンバージョン数 (ディスプレイ広告: コンバージョン数(全て)) | CV (All) or CV (Click) |
| Revenue | コンバージョンの価値 | CV value (purchased) |
Google Analytics 4
Schedule it: open a report, for example Traffic acquisition. Choose Share this report → Schedule Email. Pick CSV and a frequency: daily, weekly, monthly or quarterly. You need the Administrator role, and recipients must be users of the property. A schedule runs for up to 12 months, then stops, so set yourself a reminder to renew it. GA4 data can take up to 72 hours to settle: send monthly reports on the 4th.
By hand: Share this report → Download File → Download CSV. The Viewer role is enough.
Good to know: GA4 has no spend or impressions unless Google Ads is linked. Keep Sessions as Sessions: they are not clicks. Keep GA4 in its own file or on its own tab (chapter 3). If the CSV starts with a few comment lines, REPORTIFUL skips them and starts at the header row.
Google Ads
Schedule it: open the Report editor, open your saved report and use the email and schedule icon to set recipients, frequency and format. Or, in any statistics table, use the download icon → Schedule. Recipients need access to the account. Saved reports that nobody opens for 18 months are deleted automatically.
Google Sheets add-on: Google's free add-on can refresh a sheet on a schedule, but Google says it is available only for English-language Google Sheets in the United States.
Microsoft Advertising
Schedule it: Reporting → open a report → Schedule report → switch on Schedule this report. Choose daily, weekly or monthly, the recipients (they need access to the account), the format (.zip with CSV or TSV, or .xlsx) and Include report as an email attachment. Monthly schedules must run on day 1 to 28.
Columns: look for Impressions, Clicks, Spend, Conversions and Revenue. Add a Channel column: Microsoft Advertising.
Meta Ads Manager
Schedule it: in Ads Reporting, open your saved report. Turn on the scheduled email, either with the link under the report title or with the settings cog, add recipients, click Apply, then Save. Only single-account reports can be scheduled. You need admin, advertiser or analyst access to the ad account, and only people with access to it can open the report.
By hand: export the report as .xlsx or .csv.
Good to know: "Results" changes meaning with the campaign objective. REPORTIFUL reads it as your conversions. To report on one specific result instead, such as Purchases, rename that column to Conversions: REPORTIFUL then uses it in place of Results. The spend header includes the currency, for example Amount spent (EUR). Exports also contain Reporting starts and Reporting ends columns; you can keep or delete them.
LinkedIn Campaign Manager
By hand only: LinkedIn documents no scheduled report emails. In Campaign Manager, choose the time range, then Export. Pick a report type, for example Ad set performance, and the Time breakdown: Daily. It takes about 2 minutes. If LinkedIn matters a lot to you, consider a connector (path B in chapter 7).
Good to know: from October 2025, LinkedIn renamed its levels. Campaign groups are now called campaigns, campaigns are now ad sets, and creatives are ads. Some dashboard columns, such as Key results and Cost per result, cannot be exported.
Columns: rename the spend column to Spend, and Total conversion value to Conversion value. REPORTIFUL reads Impressions, Clicks and Conversions as they are.
TikTok Ads Manager
Schedule it: Analytics → Custom reports → open a report → Scheduled running (top right). Switch it on, then choose the frequency, up to 5 email recipients and the file format, and click Save. Only pivot-table reports can be scheduled. Reports arrive around 5 to 6 a.m. in the ad account's time zone. TikTok cancels the schedule if nobody downloads the reports for 3 months in a row, and only TikTok Ads Manager users can download them.
By hand: Export from a custom report, or on the Campaigns page use ⋯ → Export data.
Good to know: Payment completion value (page) is the revenue field for website purchase tracking. If you track other events, use their value column.
LINEヤフー広告 検索広告
Formerly Yahoo!広告 検索広告. Since 1 April 2026, Yahoo!広告 and LINE広告 are one brand: LINEヤフー広告.
Schedule it: click the 「レポート」 icon (bar chart, top right), then 「レポート・テンプレート作成」. Set the template name, the period and 「ファイル形式」: 「CSV」 and 「Excel用CSV」 both work. Click 「スケジュール」 and set 「作成スケジュール」 to 「毎日」, 「毎週(指定曜日)」 or 「指定日(毎月実行)」. Under 「メール送信(任意)」 add the addresses that should be told. Save with 「テンプレートを保存し、同時にレポートも作成」.
How it arrives: the email tells you the report is ready. Download the file from 「作成済みレポート」.
Good to know: REPORTIFUL reads both 「CSV」 and the default 「Excel用CSV」 (a tab-separated UTF-16 file). Add 「日」 under 分割項目 for one row per day. Up to 30 templates per account.
LINEヤフー広告 ディスプレイ広告
Formerly Yahoo!広告 ディスプレイ広告. It also takes over LINE広告 placements.
Schedule it: the same route: 「レポート」 icon → 「レポート・テンプレート作成」 → 「スケジュール」, then set 「作成スケジュール」 and the email address for the notice. In 「保存」▼ → 「ファイル設定」, choose 「ファイル形式」 CSV; REPORTIFUL reads either 「文字コード」 option.
Good to know: LINEヤフー plans to redesign this console on 20 October 2026, so labels may change, and Shift_JIS downloads are being removed from that date. LINEヤフー recommends コンバージョン数(全て) for comparisons. Reach figures refresh once a day.
LINE広告 (legacy)
By hand only: [≡] → 「レポートと計測」 → 「パフォーマンスレポート」 → 「+レポートを作成」. Set 集計期間, 集計間隔 「日別」 and the file format, then click 「作成する」. The report list shows only reports created in the past week.
Good to know: the column names are in English, for example Impressions, Clicks, Cost, CV (All) and CV value (purchased). REPORTIFUL reads Impressions, Clicks and Cost as they are; rename CV (All) to Conversions and CV value (purchased) to Conversion value. CV (All) can include conversions other than purchases, such as friend-adds, if you track them. Cost is LINE's estimate and can differ slightly from the invoice.
HubSpot
Schedule it: Reporting → Reports → hover over a report → Actions → Share via → Email, then choose "Yes, this is a recurring email". Daily, weekly or monthly. A CSV, XLS or XLSX file is attached for some report types (single object, event-based and customer journey reports). Other reports arrive as an image, which REPORTIFUL cannot read. Recurring emails go to HubSpot users only.
Columns: they depend on the report. Keep HubSpot's own names, for example Sessions, New contacts, Customers and Revenue.
Mailchimp
By hand only: Campaigns → View report → Actions → Export CSV. For all campaigns at once: Campaigns → View analytics → Download All Reports. Mailchimp emails you when the file is ready.
Columns: keep Mailchimp's own names. Add a Channel column: Email. For email-only files, choose the Email Marketing Report type.
Klaviyo
Schedule it: Analytics → Custom Reports → open a report → Save & Run → Schedule Report. Weekly or monthly. Klaviyo emails a download link (log-in required) to the person who set it up, not an attachment. Up to 10 scheduled reports per user.
Columns: keep Klaviyo's own names. Add a Channel column: Email.
Appendix BStandard layout and checklists
One layout for every client file, and three checklists to print or bookmark.
Your standard column layout
| Column | What it holds | Example | Needed? |
|---|---|---|---|
| Date | The day or period of the row | 2026-09-01 | Recommended |
| Channel | The platform or channel | Google Ads | Yes, for blended reports |
| Campaign | Campaign, ad set or email name | Autumn Sale | Recommended |
| Spend | Cost, in one currency | 1,240.00 | If you have it |
| Impressions | Times shown | 18,400 | If you have it |
| Clicks | Clicks or link clicks | 1,310 | If you have it |
| Conversions | Purchases, leads, sign-ups | 64 | If you have it |
| Revenue | Revenue, or a conversion value if you have no revenue column | 6,820.00 | If you have it |
| Target columns | Your plan, for example Target ROAS or Planned Spend | 4.0 | Optional |
| Other metrics | Under their own names, for example Sessions, Opens, Leads | 2,950 | Optional |
Five rules
- Rename a column only when the meaning is the same. Cost, Amount spent and Total Spent are all Spend.
- Keep different metrics apart. Sessions are not clicks, GA4 key events are not your platforms' conversions, and recipients are not impressions.
- Leave cells empty where a metric does not apply.
- One currency in the whole file.
- No ratio columns needed. REPORTIFUL calculates CTR, CPC, CPA and ROAS from your totals.
Checklist: set up once (per client)
- A path chosen for each platform: scheduled export, connector sheet or manual
- Scheduled exports set up on your reporting cadence, sent after the data has settled
- One mail folder per client, with an email rule
- One file layout, kept the same every month
- A REPORTIFUL template saved for the client
Checklist: every cycle
- New exports collected
- Rows pasted into the standard table, Channel column filled
- File uploaded, client template selected
- Report Type and Reporting Period checked
- How your file was read checked, if it appears
- Report generated, reviewed and enriched, then sent
Checklist: before you send
- Cover: client name, period, logo
- Reporting Period checked
- Three headline figures checked against the source
- Accuracy check result read
- Comparisons and recommendations make sense for this client
- Your own context and view added
Trademarks
Product and company names in this guide, such as Google Analytics, Google Ads, Meta, LinkedIn, TikTok, Microsoft Advertising, LINEヤフー広告, LINE広告, HubSpot, Mailchimp and Klaviyo, are trademarks or registered trademarks of their respective owners. This guide is independent and not affiliated with or endorsed by them. REPORTIFUL is a registered trademark of Marketing Surfer GmbH.